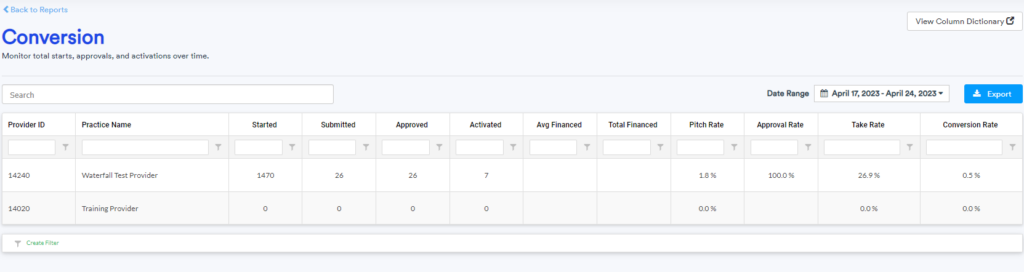
See a summary of how many applications were started and converted to active payment plans as a whole or by credit grade.
To run this report;
- Log in to the provider portal
- Navigate to the Reports tab
- Select the report titled Conversion Report
- Enter the date range you wish to view
*Tip: For providers and partners with multiple locations. Use the search bar to find the data of a specific location
To export the report, simply click download to view it in Excel
Status Definitions:
- Starts= Minimum applicant information has been entered by the provider/partner through Easy Apply or an integration.
- Submitted= The applicant has completed the underwriting step in their application flow
- Approval= The applicant was approved and has been presented with offers
- Activated= An offer has been selected and the patient has completed the checkout
- Pitch Rate= The Pitch Rate measures how effective the treatment coordinator “sells” HFD financing to the applicant.
- Approval Rate= The Approval Rate measures the percentage of applicants that received an approval after underwriting.
- Take Rate= The Take rate measures the attractiveness of the offers presented to the applicant. Of the offers presented, how many applicants selected an offer and completed checkout. A payment plan is now active.
- Conversion Rate= The Conversion Rate measures the percentage of started vs. active applications. It is indicative of the overall success of the program.
To better understand the status column, see the article Conversion Funnel Explainer